The Ercule Blog
Our Writing


What is a content system?
Adapting your content system for AI search
Design a content system for scalable SEO
SEO + GEO: big changes on my mind for 2026
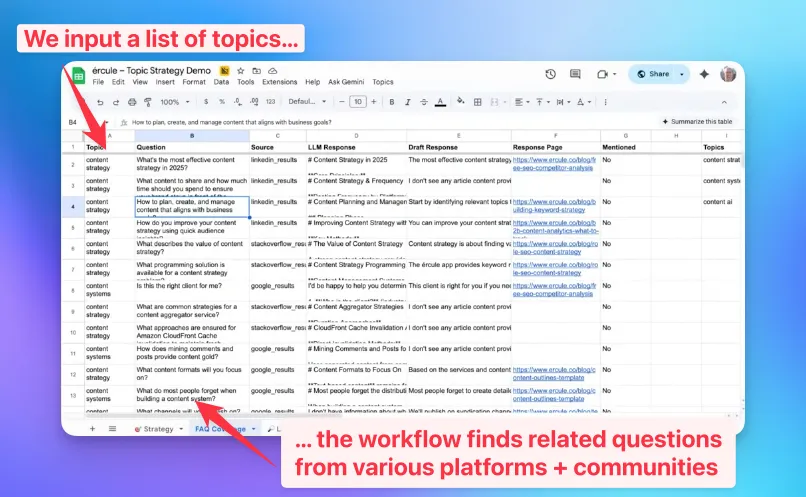
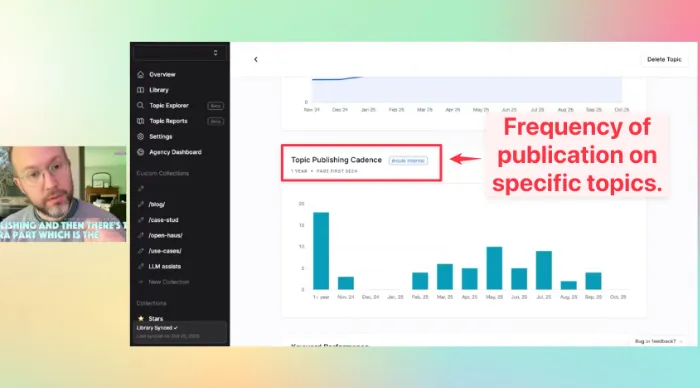
FAQ content: how we create (and automate) it
Increase your content velocity and the search traffic will follow
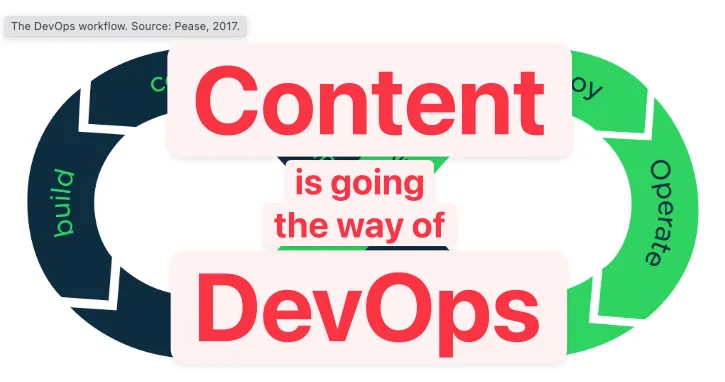
Content is going the way of DevOps

Content engineering is bigger than AI
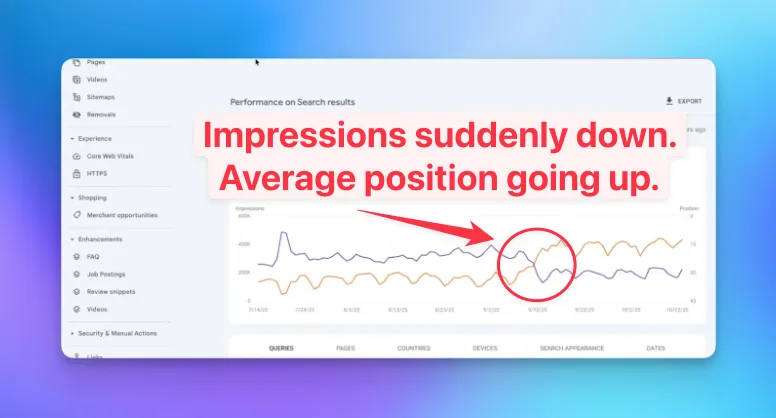
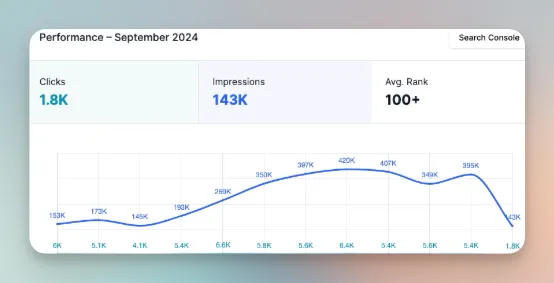
Google killed “num=100”. It’s changing your performance metrics.
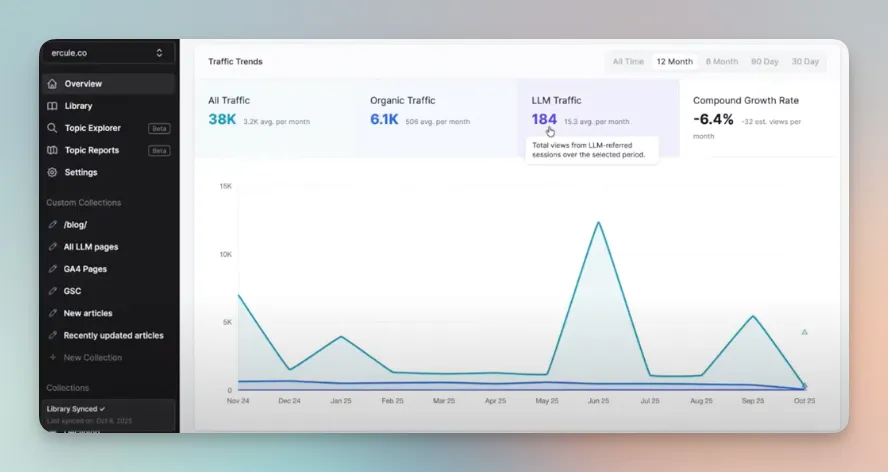
A dashboard for LLM traffic

Google Search Console: Getting Started
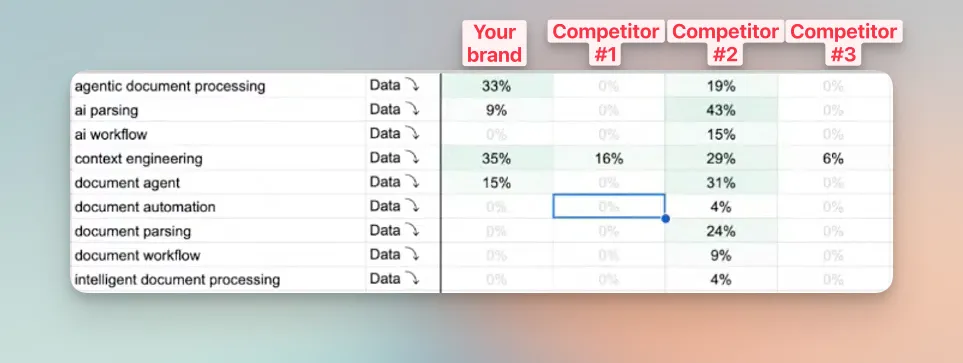
LLM brand visibility: how we track it

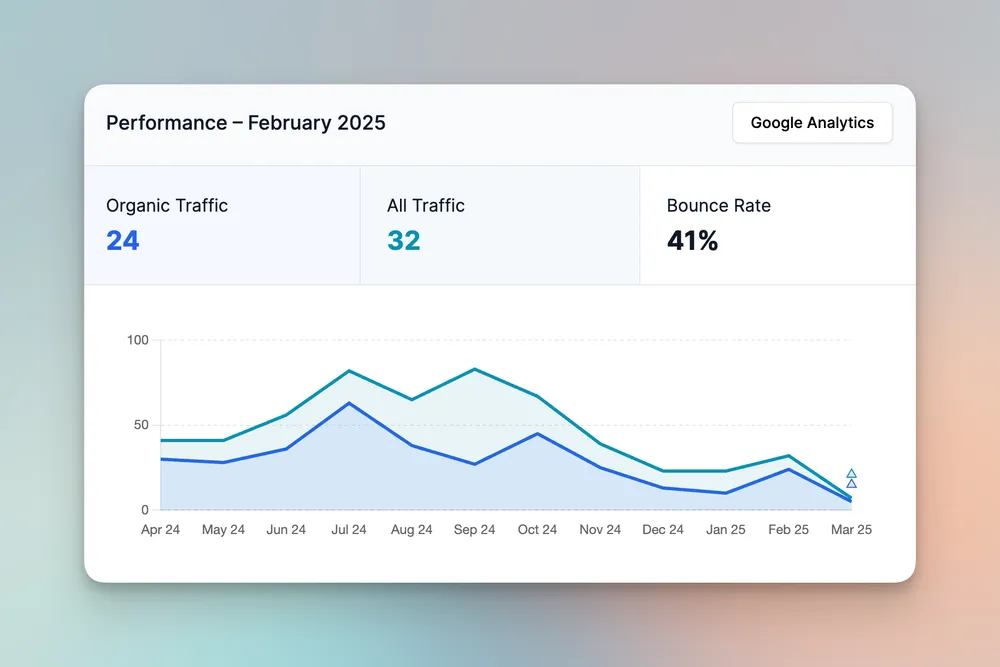
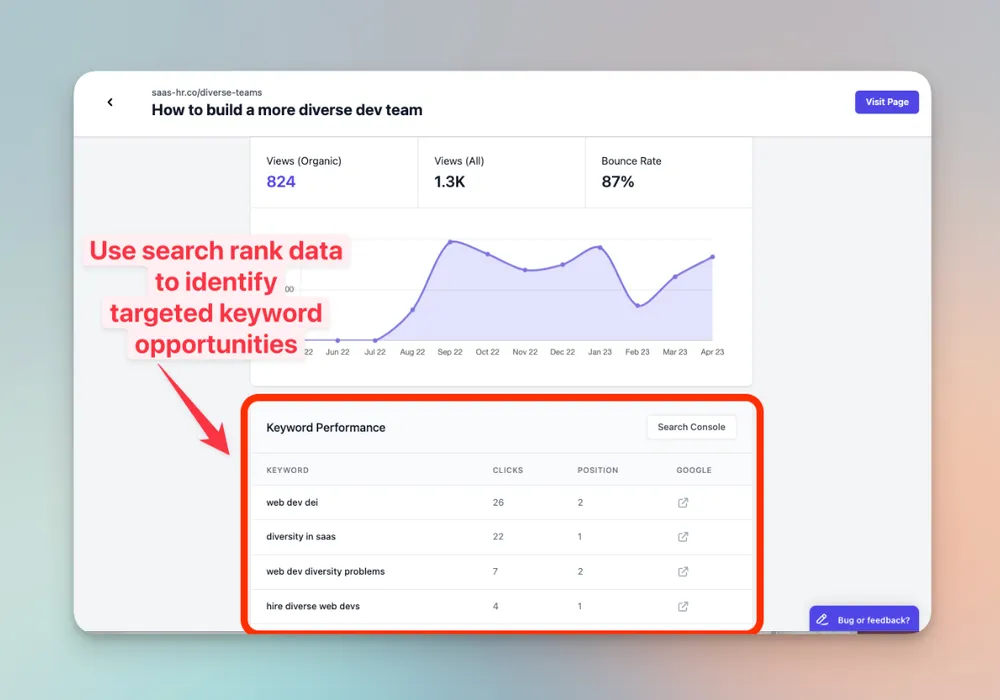
Content ROI: measure your impact with this GA4 report
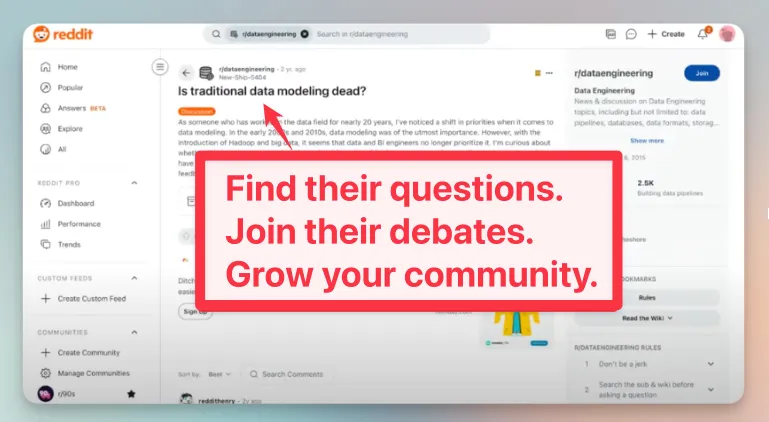
How to find customer questions on Reddit – and answer them at scale
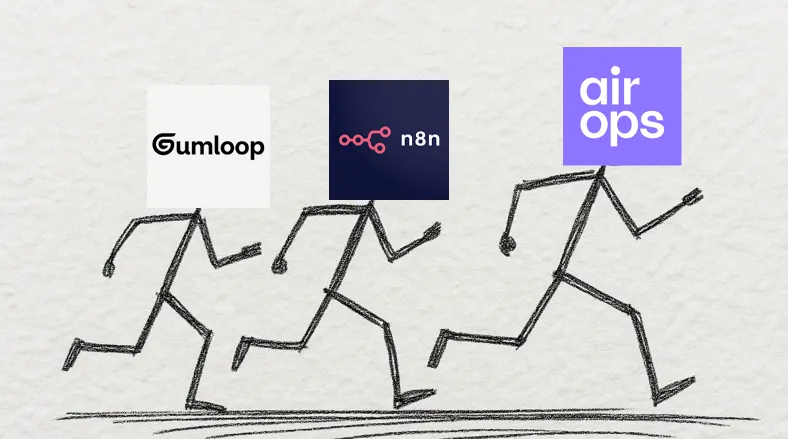
AirOps vs Gumloop vs n8n: AI workflow automation tools

Refresh your old tutorial pages with these LLM workflows
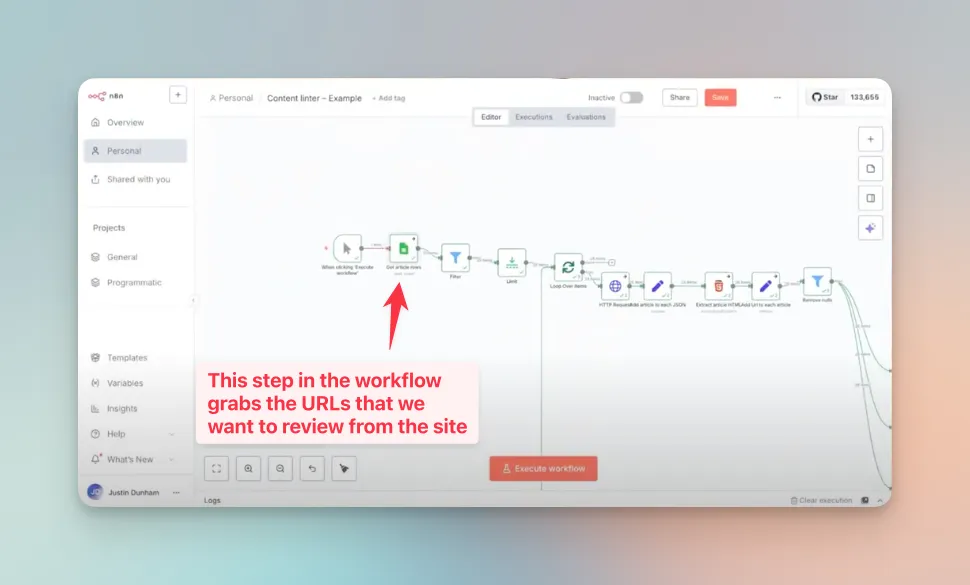
Build this LLM workflow to spellcheck your entire website

What it takes to build a great content system
LLM search FAQ
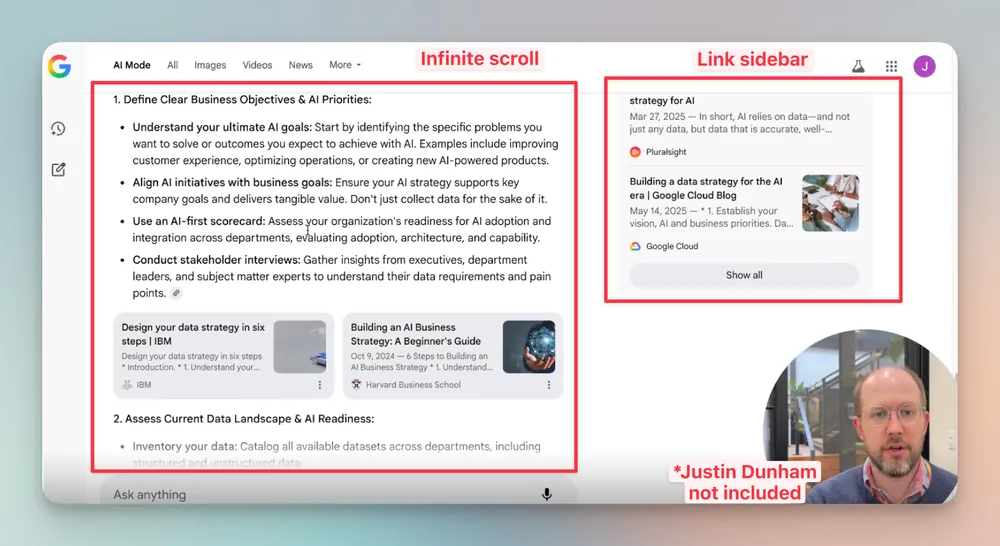
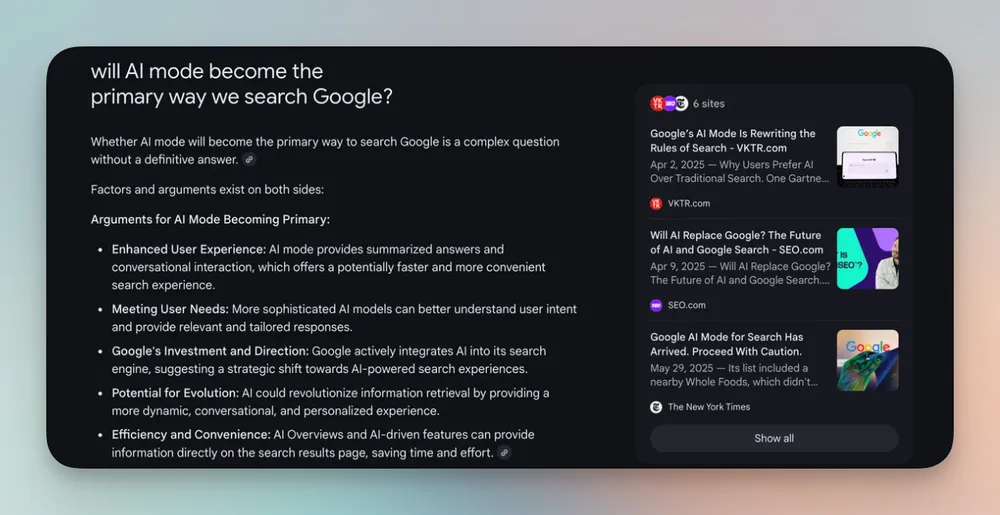
What is Google AI Mode? What does it mean for content marketers?

Using ChatGPT to optimize blog content
How to build topical authority in SEO: A beginner's guide
Declining traffic: How to stop content decay

What’s the role of SEO in content strategy?

Using CRO and SEO to optimize engagement
Topics vs keywords in SEO: strategy, research, and implementation

SEO is not useful without CRO
ércule app update: November 2024
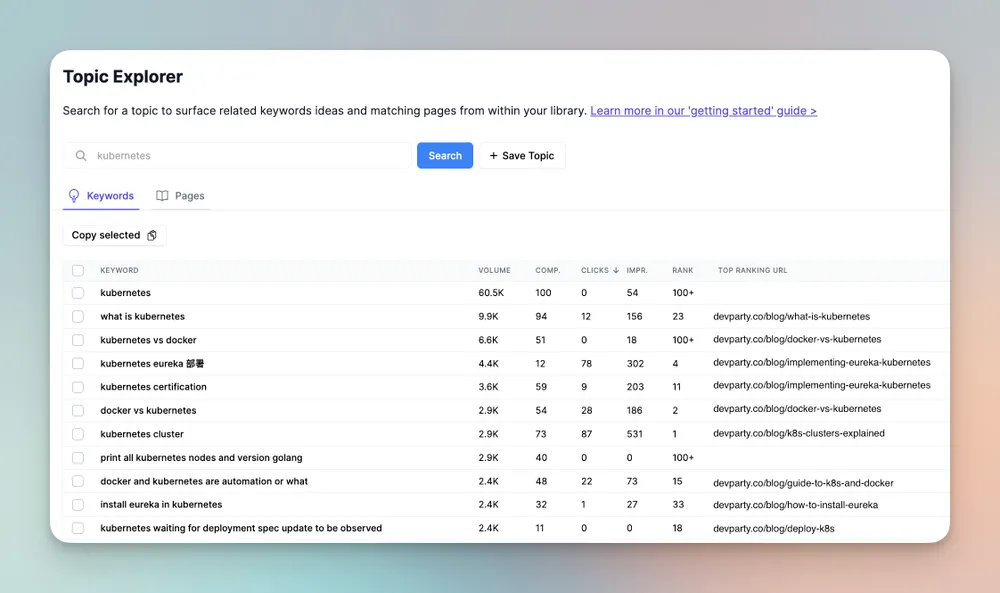
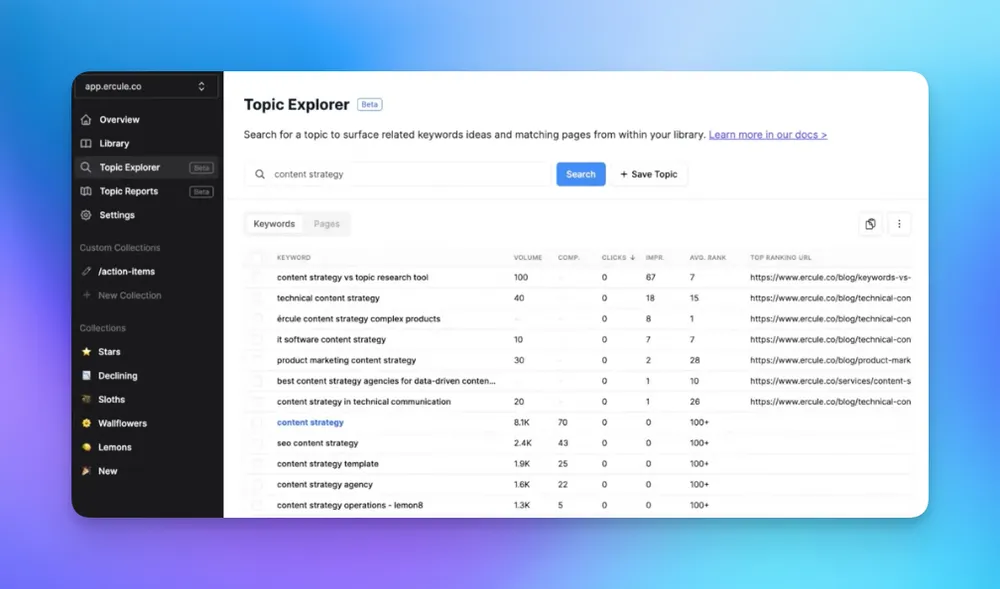
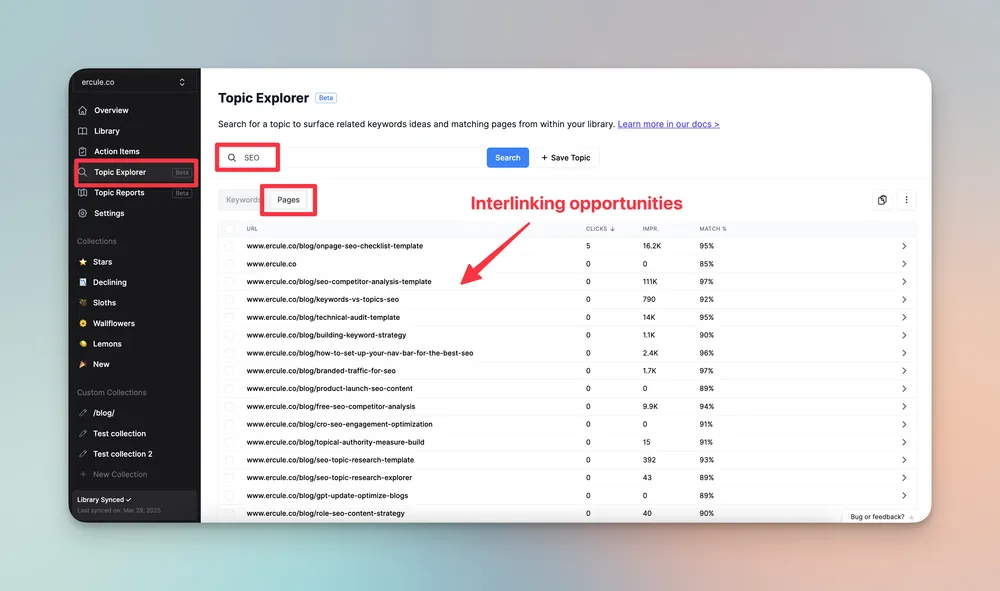
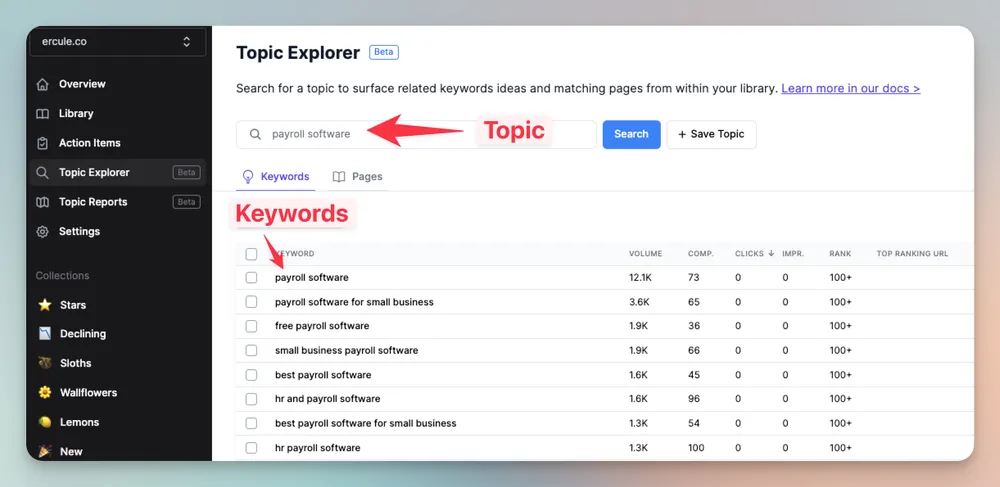
How to do SEO topic research with Topic Explorer

ércule app update: October 2024
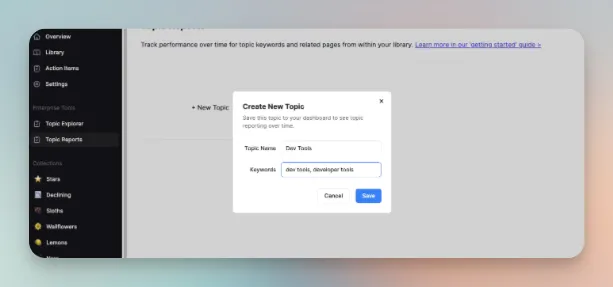
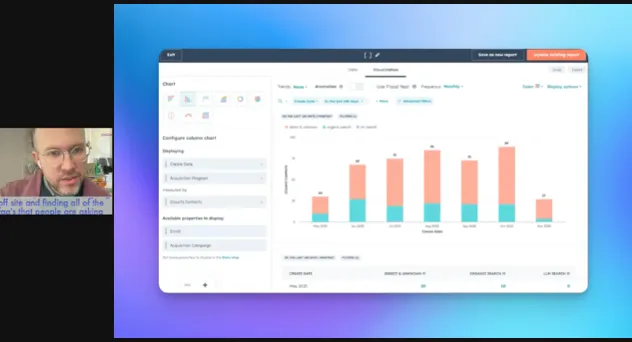
Using ércule’s Topic Reports to monitor your topical authority
Measure and build topical authority in SEO
Content optimization strategy: process, examples, tools, and templates

WordPress static site generator: Why it’s fantastic for content

Content optimization tools: A quick way to boost performance

Google Analytics vs. Search Console: Do you need both?

Google Tag Manager security risks: what marketers and engineers need to know
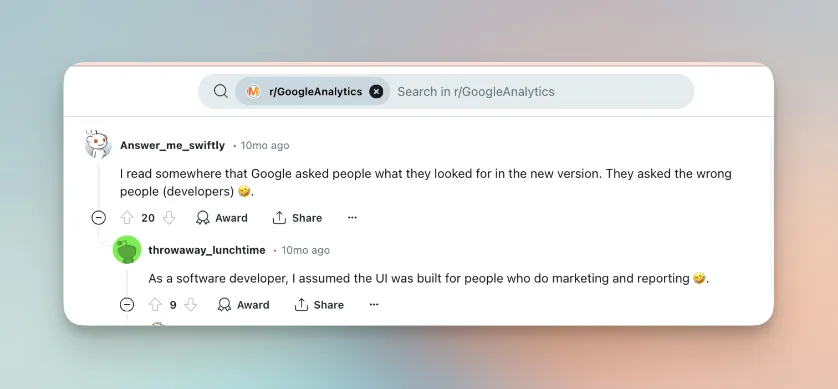
GA4 is bad for marketers

Technical content pipeline: How do you manage it?

How to make content evergreen [with examples]

Technical content strategy: What should you write first?

On-page SEO checklist template + guide
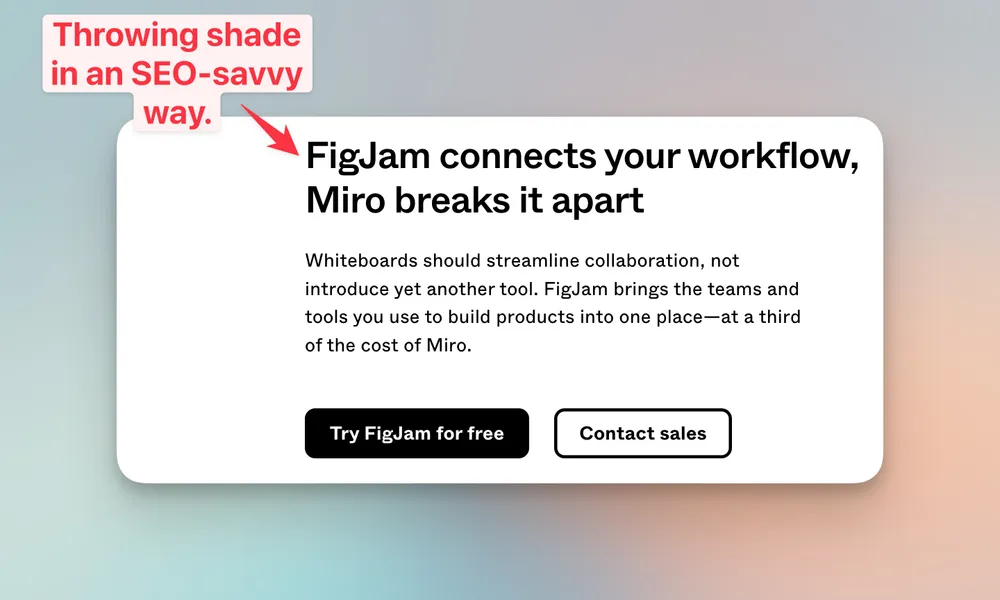
How to write competitor comparison landing pages [with examples]

How to back up and save your Universal Analytics data
Social content reuse library

Product marketing template for content marketers

Making maintenance part of your technical content strategy

Get started with SEO topic research

How to turn documentation into organic SEO content
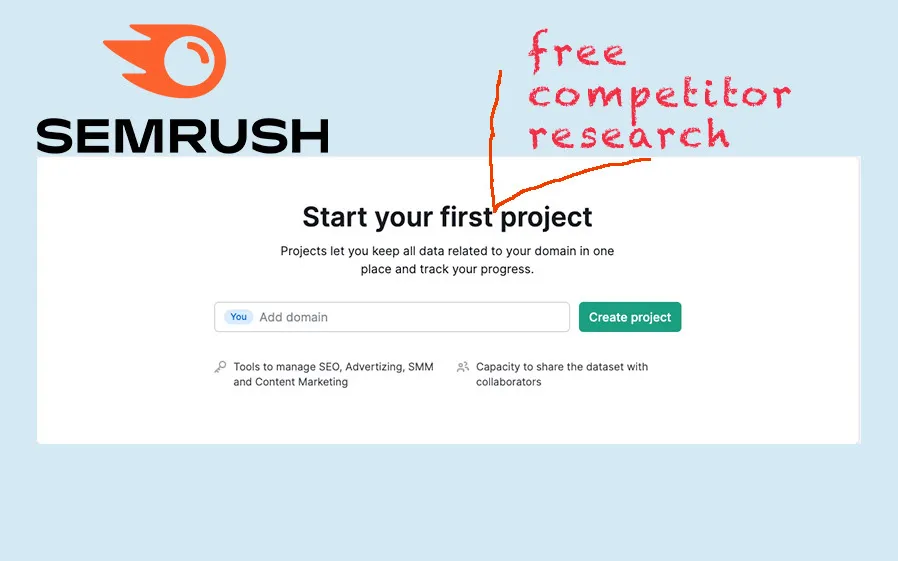
How to do free SEO competitor analysis
Creating targeted content for a startup audience
Aligning existing content with strategic themes
Outdated content: how to find and refresh it

Improving marketing attribution
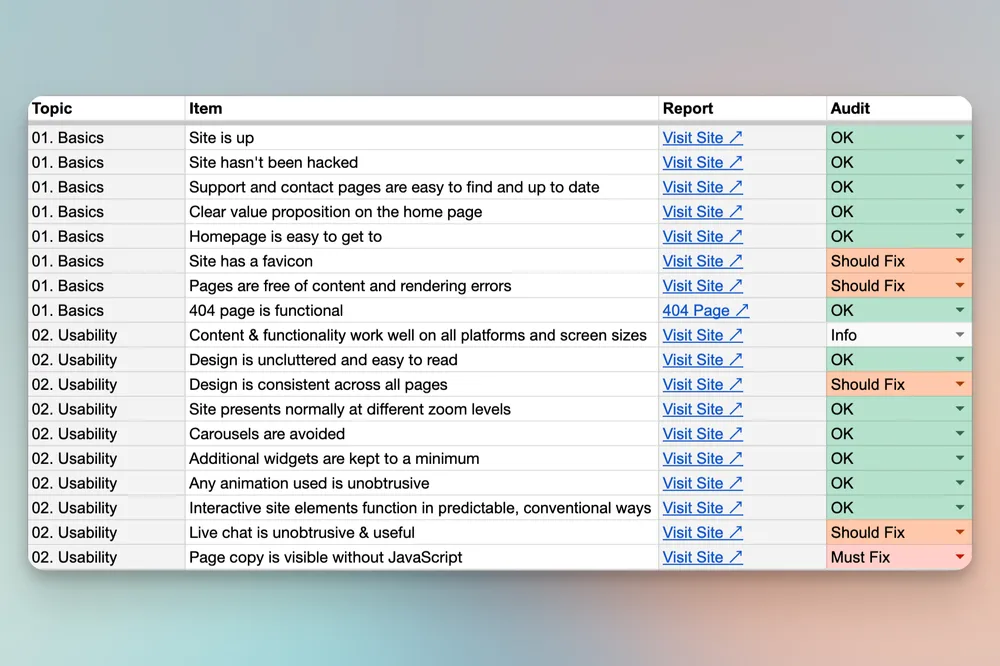
Technical SEO audit: how-to & template

How to create SEO content for a product launch

Technical tips for posting on LinkedIn
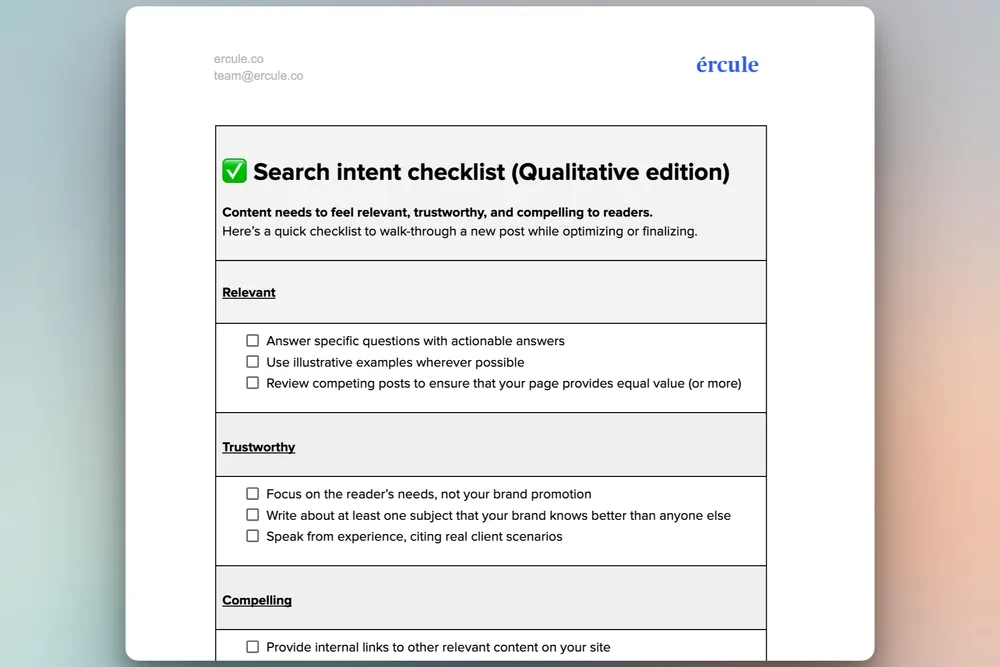
Search intent checklist
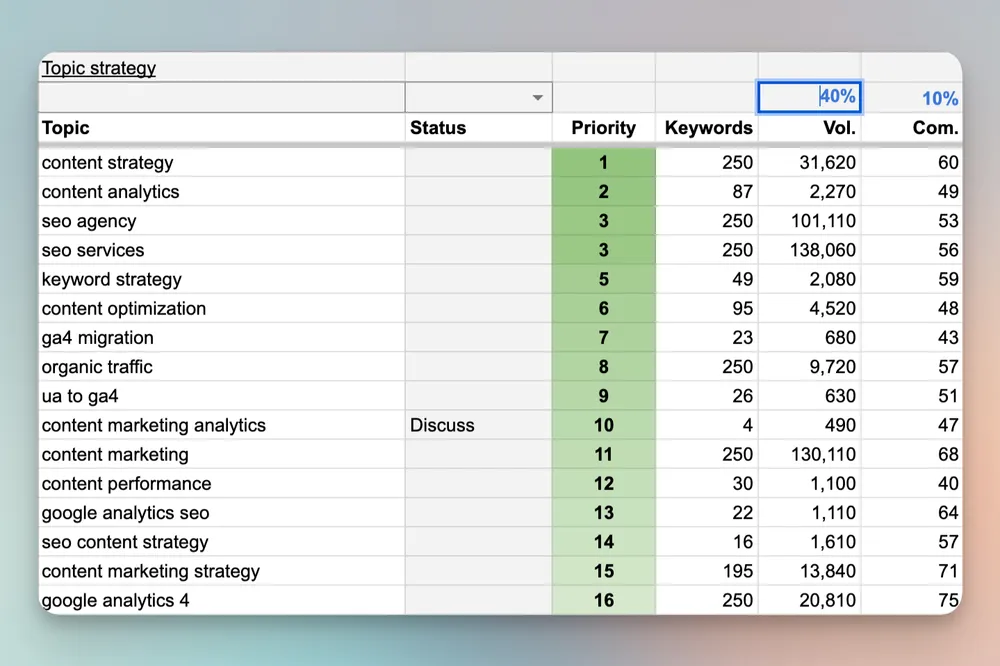
Topic strategy & tracker: how-to & template
Technical content: Four common mistakes that undermine your work
Lazy-load scripts in Google Tag Manager

Hashnode Headless: A content engine for technical companies
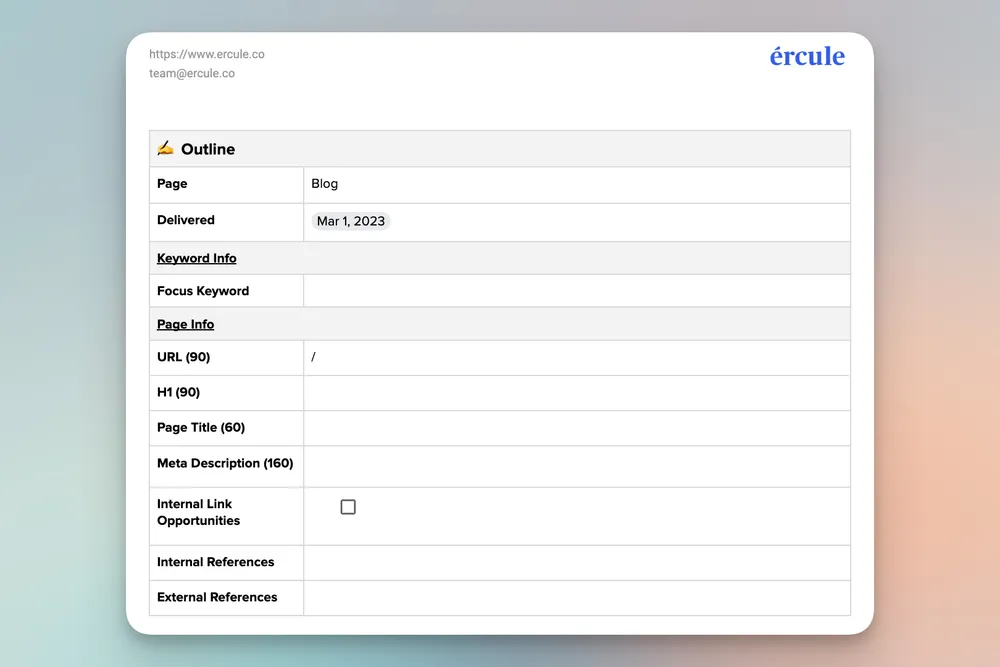
Content outlines: how-to & template

Technical facts reference library

Optimization audit: how-to & template
Integrate 6sense & Google Analytics
Tag site visitors by page source
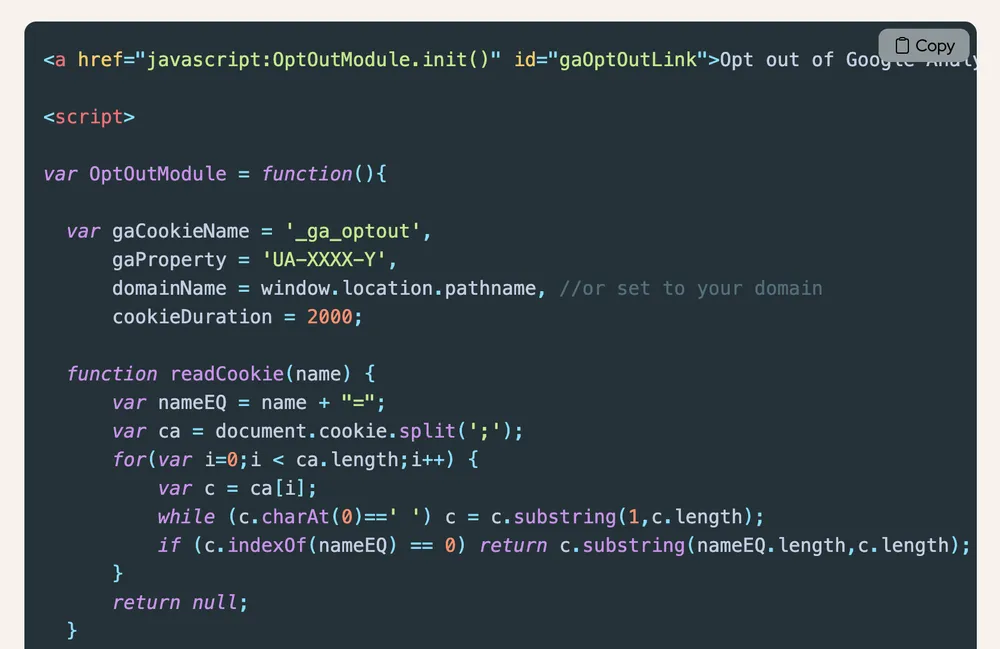
Google Analytics visitor opt-out Javascript
Content Strategy Quickstart
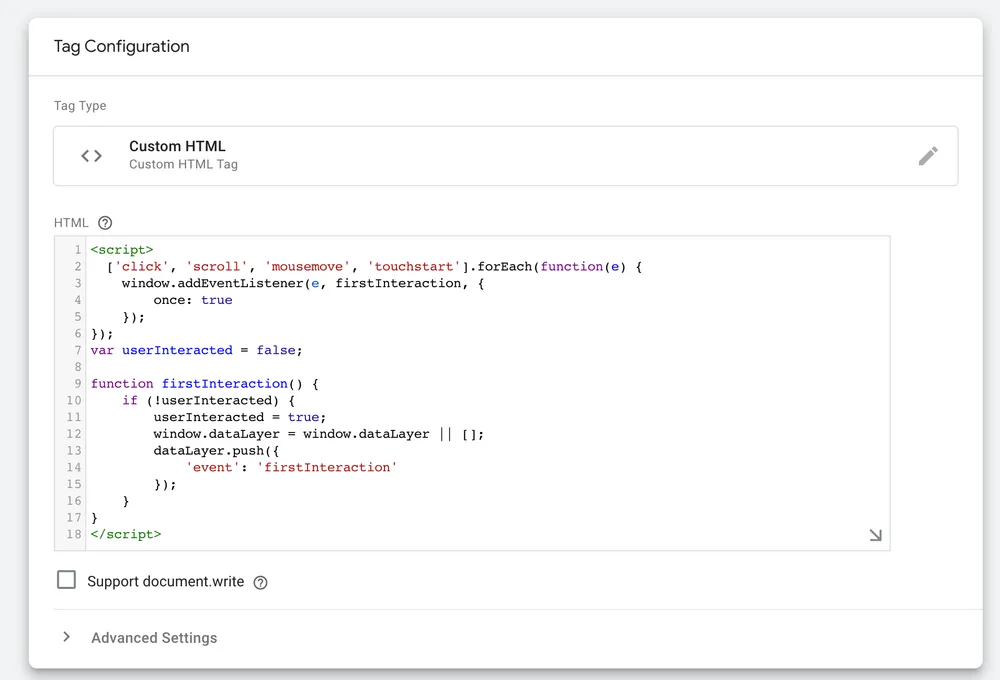
Firing Google Tag Manager events for Hubspot forms
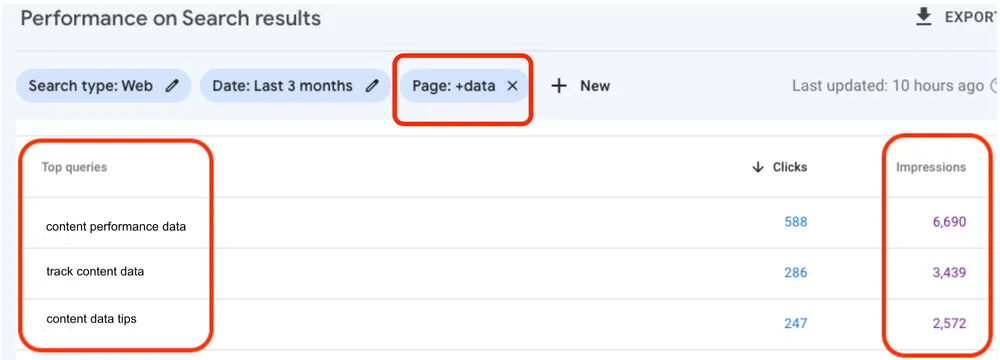
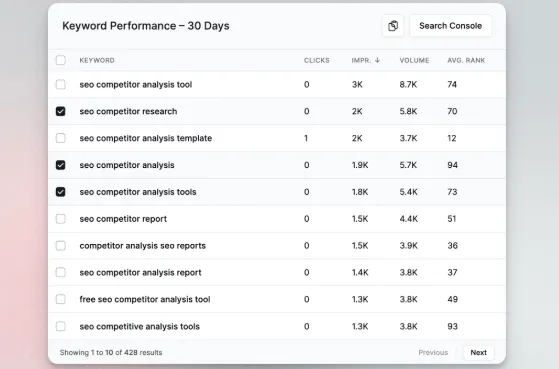
Using Impressions to improve content performance

How to track revenue from organic search
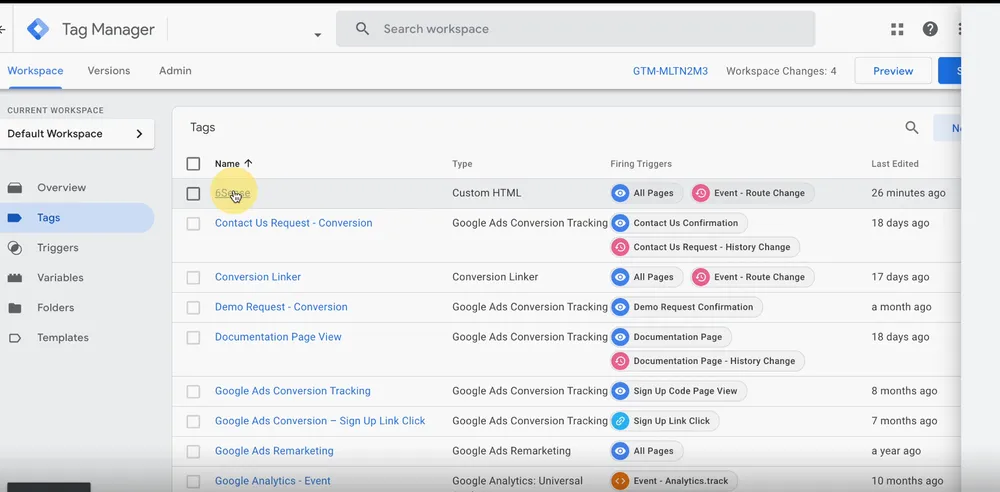
Google Tag Manager: setup, tips, and more
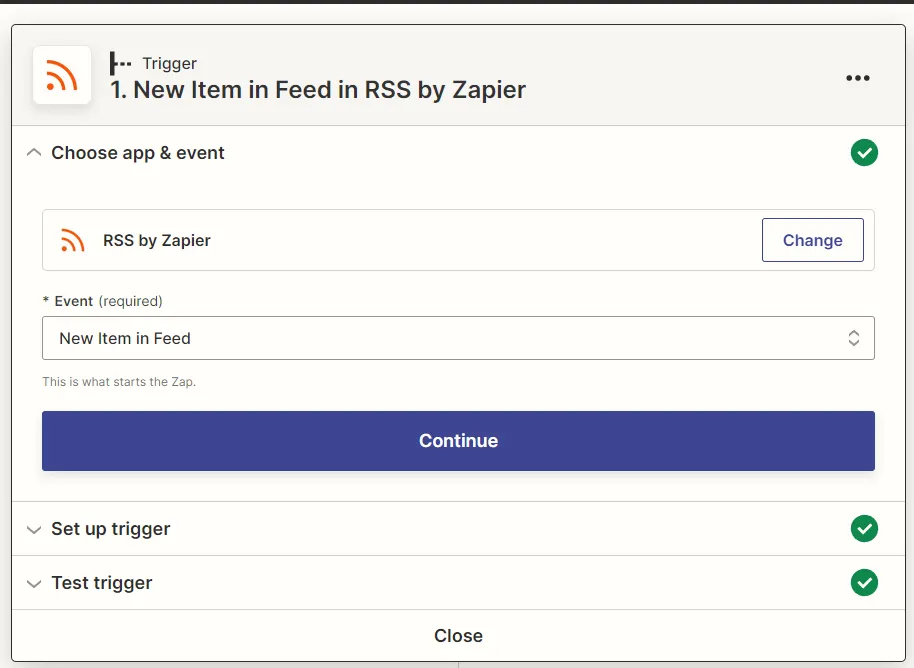
Automatically syndicate your content to Medium
How to reduce bounce rate on a page
How to measure and update existing content
Principles for building content systems
What’s the difference between bounce rate and exit rate?

Content analytics: what to track
Turning keywords into blog post titles
How to fix declining traffic
Topic research for B2B content marketers
Comparison page best practices
What is direct traffic in Google Analytics?
Is keyword cannibalization really a problem?
How to set up Google Search Console
Content marketing analytics tools: what to choose
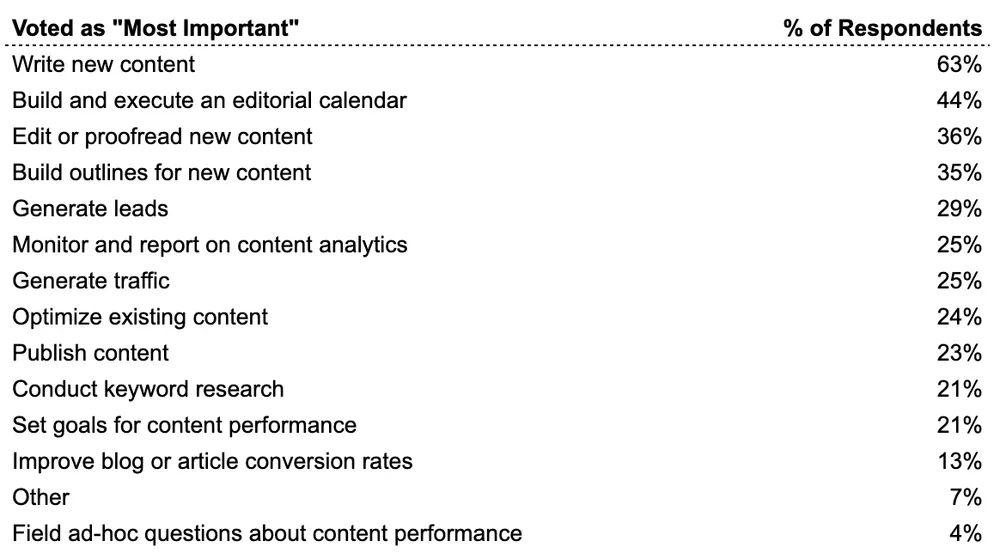
How Content Marketers Spend Their Time
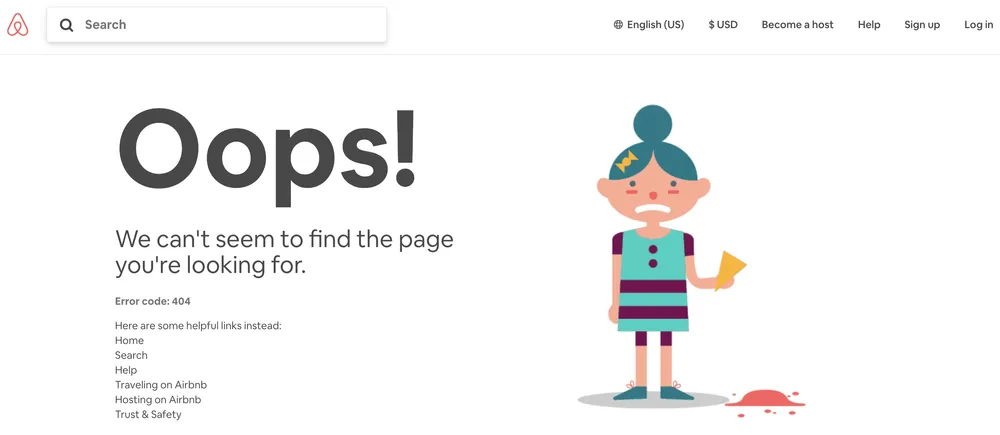
404 page best practices
Nav bar SEO best practices
GA4: Bounce rate and engagement rate explained
Understanding engagement metrics in Universal Analytics
Marketing attribution setup for B2B companies
What is "share of search"?
UTM parameter best practices
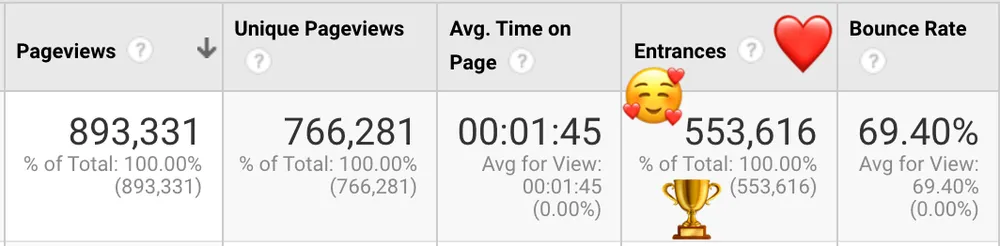
How to calculate Retained Entrances
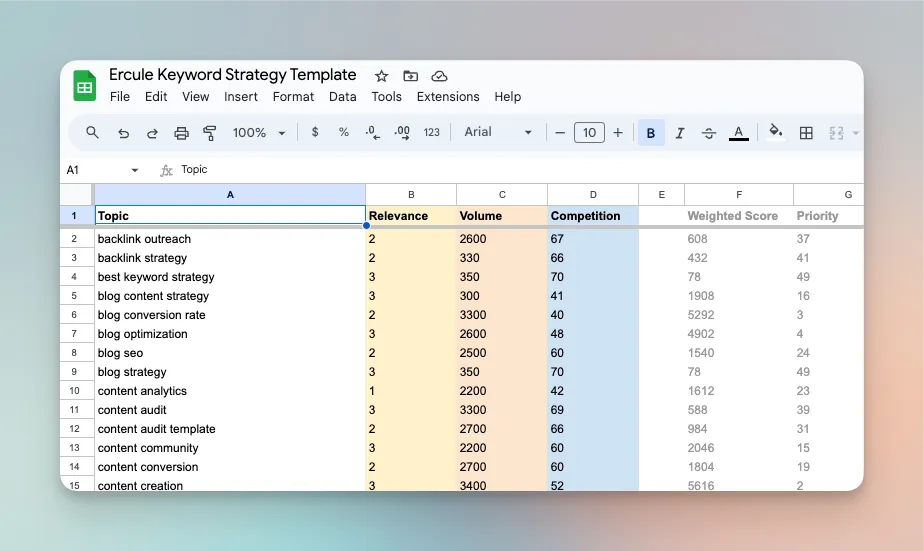
How to build a keyword strategy: process & template
How to serve language-specific sites
We’re *actually* here to help
We’re marketers who love spreadsheets, algorithms, code, and data. And we love helping other marketers with interesting challenges. Tackling the hard stuff together is what we like to do.
We don’t just show you the way—we’re in this with you too.
