


Customer journeys aren’t linear. At least mine aren’t.
I visit a B2B website a dozen times, poke around, come back weeks later and then, maybe, request a demo.
As customers, our journeys are open and unpredictable. That’s why it’s so hard to connect the dots between website content and pipeline.
How do we pull data that can account for that kind of journey?
I use a simple GA4 report. You can too. In this post, I'm going to show how that mighty little report works.
Here’s the video version 👇
Overview: simple content ROI calculation
I’m going to pull a report in GA4 that shows the total number of users who viewed website content and also completed a “key event” (a.k.a. conversion).
With that info we can complete a simple equation:
[ Total users converted ] x [ Value of conversion ] = [ Value of content ]
Yes, this is a pretty reductive way to gauge value. No blog post is solely responsible for a conversion the way that an event might be. But this equation is quantifying influence.
Example
Let’s say the GA4 report tells us the following: in the past 90 days, 10 people who landed on a certain blog page ended up, at some point, as converters.
A booked demo call is worth, let’s say, ~$200 to your sales team. So the value equation for that blog post is: 10 x $200 = $2000
$2000 of value in the past 90 days from one blog post? That's, potentially, pretty good.
If you run this same report + calculation for the entire blog, the value is even more compelling.
It’s a way to show your stakeholders how content influences conversion. And there’s no risk of cooking the books here.
This is a conservative metric
If anything, this report is massively understating the value of this content and all the other things it does for the company.
By which I mean: the total number of leads shown in this report is almost certainly lower than the actual number of leads influenced by your content. This speaks to the challenge of tracking something as diffuse as content. Your content shows up in a variety of places: on social platforms, in email attachments, shared by sales teams.
What we’re measuring here is only the content that is engaged on your website. So it’s conservative. You don’t have to worry about bringing an inflated metric to the stakeholder meeting.
How I set up this content ROI report
We’re pulling a report on website visitors who fit both of the following criteria:
- They visited a “/blog” page on our website
- They completed a “key event” (a.k.a. they converted)
In other words: this report will show how many of the total website visitors are influenced by content on their way to converting.
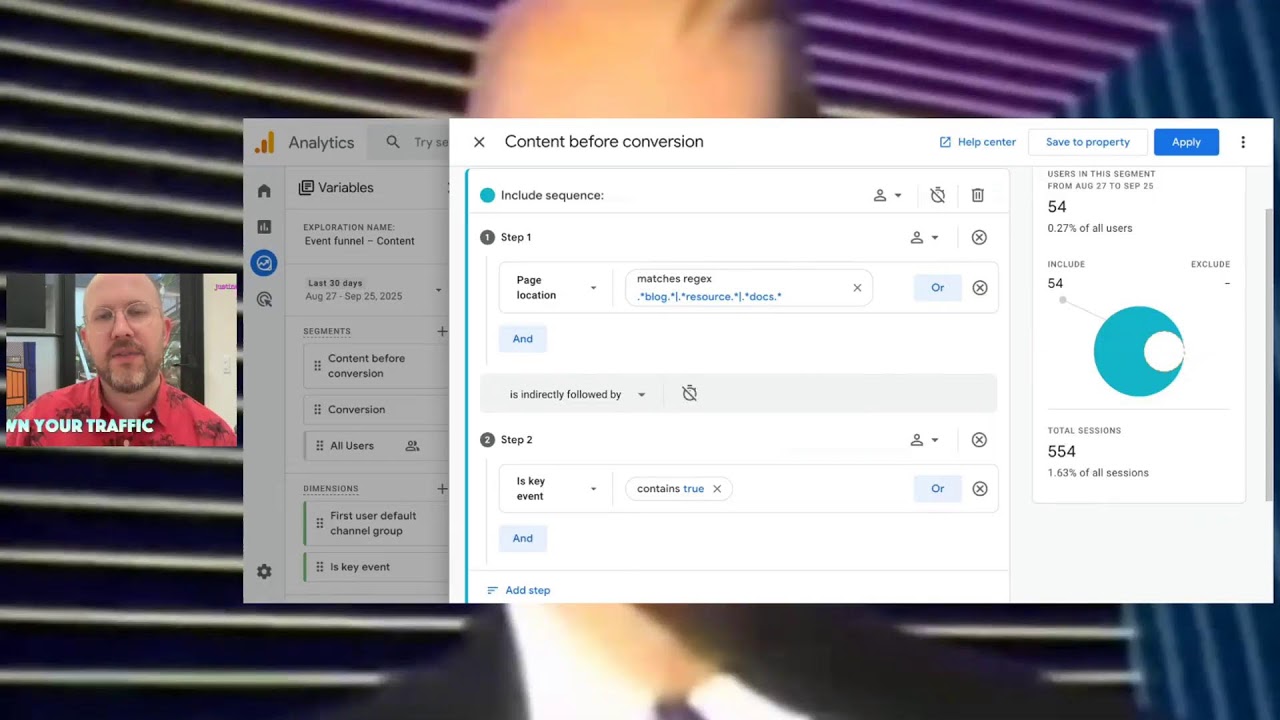
Since there’s a chronological progression here – first they visit, then they convert – these criteria are set up as “steps” in the report. They’re set up as two distinct fields in the Step tab:
- Content
- Key event

In other words: this report will show how many of the total website visitors are influenced by content on their way to converting.
Prerequisites
- Google Analytics implemented correctly.
- Having a key event set up.
A key event is any action that is significant to your sales or marketing process. It might be a submission form filled out, or a demo requested, or a CTA button clicked. This Google guide will show you how to set up a key event.
The Content field
The step labeled Content will identify whether a visitor has landed on any page that fits the criteria (or regex) that I’ve laid out.
In this instance, it’s looking for any pages that had “blog” or “resource” or “docs” in the URL.

This way, the report will include anyone who has visited the company’s blogs, documentation, or downloadable content library.
You can use this for any pattern on your site. You could use it exclusively for product pages. You could use it for the homepage. But for now we're going to talk about sort of our general content pages.
The Key Event step
In the setup tab, the Key Event step is simply a true/false filter. In other words, it’s analyzing all of the events that a visitor performed to see if any of them were Key Events.

What’s the difference between an event and key event in GA4? Basically, it’s just a matter of clicking on a little start icon next to any particular event.
You can label any sort of click as an event. Clicking from a blog post to a product page, for example. Might be an event. Typically, a key event is one that has a relatively big impact on your sales funnel.
- Contact form submitted
- Demo form submitted
- Webinar sign-up
- Whitepaper download
This report won’t show you every step in between a person’s first visit and their key event – but it will show you whether your website content was part of the journey. That’s the simple way that it accounts for the open funnel.
How many conversions were influenced by content?
This sample report shows that 8,200 users touched content on this website and 54 of them went on to trigger a key event.

That conversion rate is less than 1%. That's not a particularly great conversion rate. Still, it’s useful data.
This report only shows users who had a key event. Which is helpful because…
- We’re not counting anyone twice.
- We’re not counting two events from the same user.
These are leads who have spent some time on your site. As a result, they’re typically pretty well qualified.
The value calculation
Let’s run the simple value equation with the data from the example above:
54 leads x $300 per lead = $16,000 of value in the past month
Not bad for a content library that is sitting on your website, accruing value.
And again: this is a conservative metric. Your content almost certainly influenced more conversions than are reflected in this report. Still, it’s a way to tell the story of your content’s real value.
Your work is valuable and you can prove it
The more that you can quantify your impact, the easier our jobs become. And if you’re trying to get a CEO’s attention, data is a pretty reliable way.
Once you have a report like this in hand, what can you do with it? I say: use it to advocate for yourself. If you need a bigger budget for the next fiscal year, show up to the planning meeting with some data in hand.
Let the stakeholders know: this is why it's important to invest in a content system! It really does make you money!
